
Redrawing the Poverty Line: Why America’s Most Quoted Number No Longer Measures What It Claims To
How the U.S. Poverty Line Fails Families Today — And the Economic Case for Redrawing It

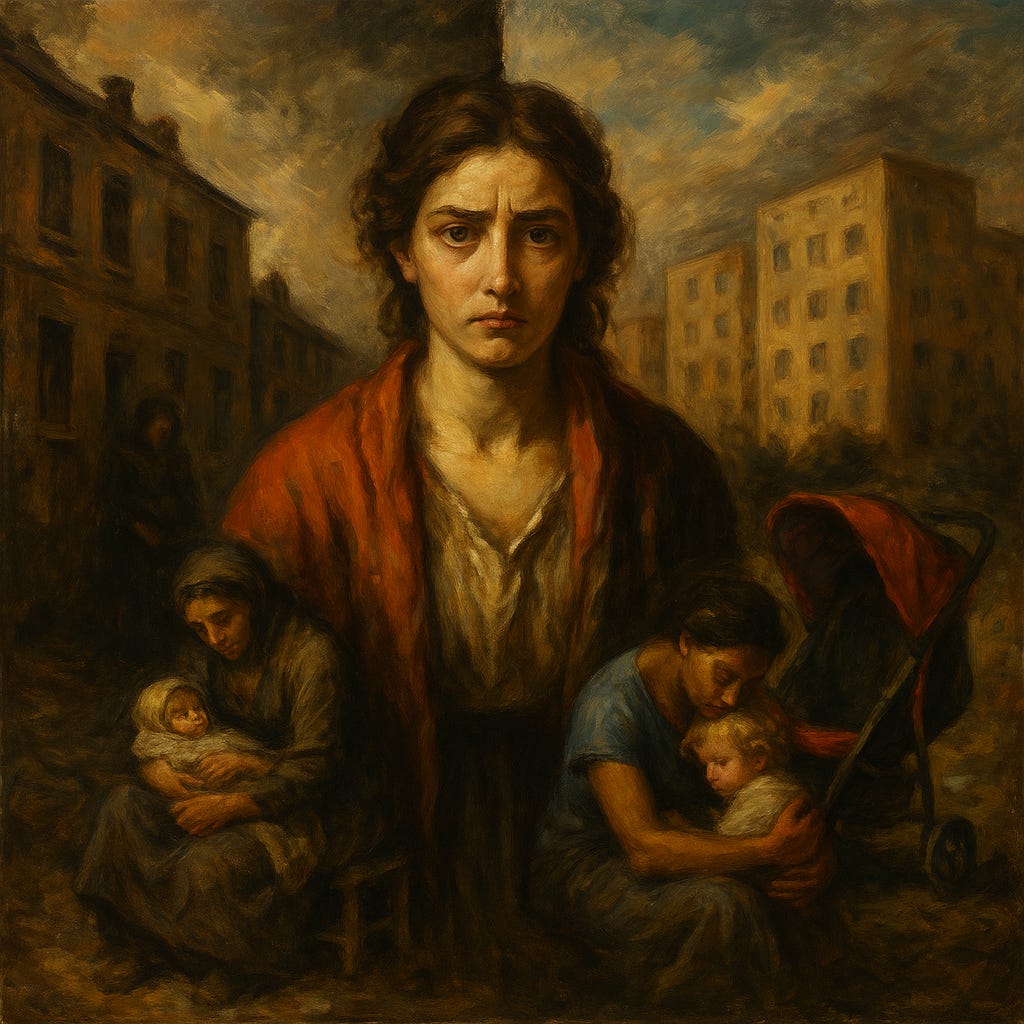
Prelude: Steel Yard Burden
We were forged in the furnace of the early machines,
back when smoke wrote scripture and sweat paid the rent,
when the city coughed coal dust into newborn lungs
and men clocked in like metronomes in a factory’s chest.
You load sixteen tons, what do you get?
Another dawn breaking on a debt you can’t forget.
It was the end of the 19th century
the gears of industry grinding louder than the voices
of the people feeding them.
Progress had a price tag,
and no one bothered to ask whether workers
could afford the world they were building.
So reformers gathered in settlement houses,
counting crumbs and casualties,
trying to name a thing that felt unspeakable:
what does it mean to be poor in a nation becoming rich?
And the government, in its love of ledgers,
held up a ruler carved from 1963
and decided that was good enough.
One measure.
One math problem.
One line in the sand.
But the world kept rising like smoke,
and here we are
still trying to weigh human struggle
with a scale carved in another century.
Movement I: The History Of The Line We Outgrew
TLDR: The U.S. poverty line was designed for a mid-20th-century economy and never truly caught up with how people live now.
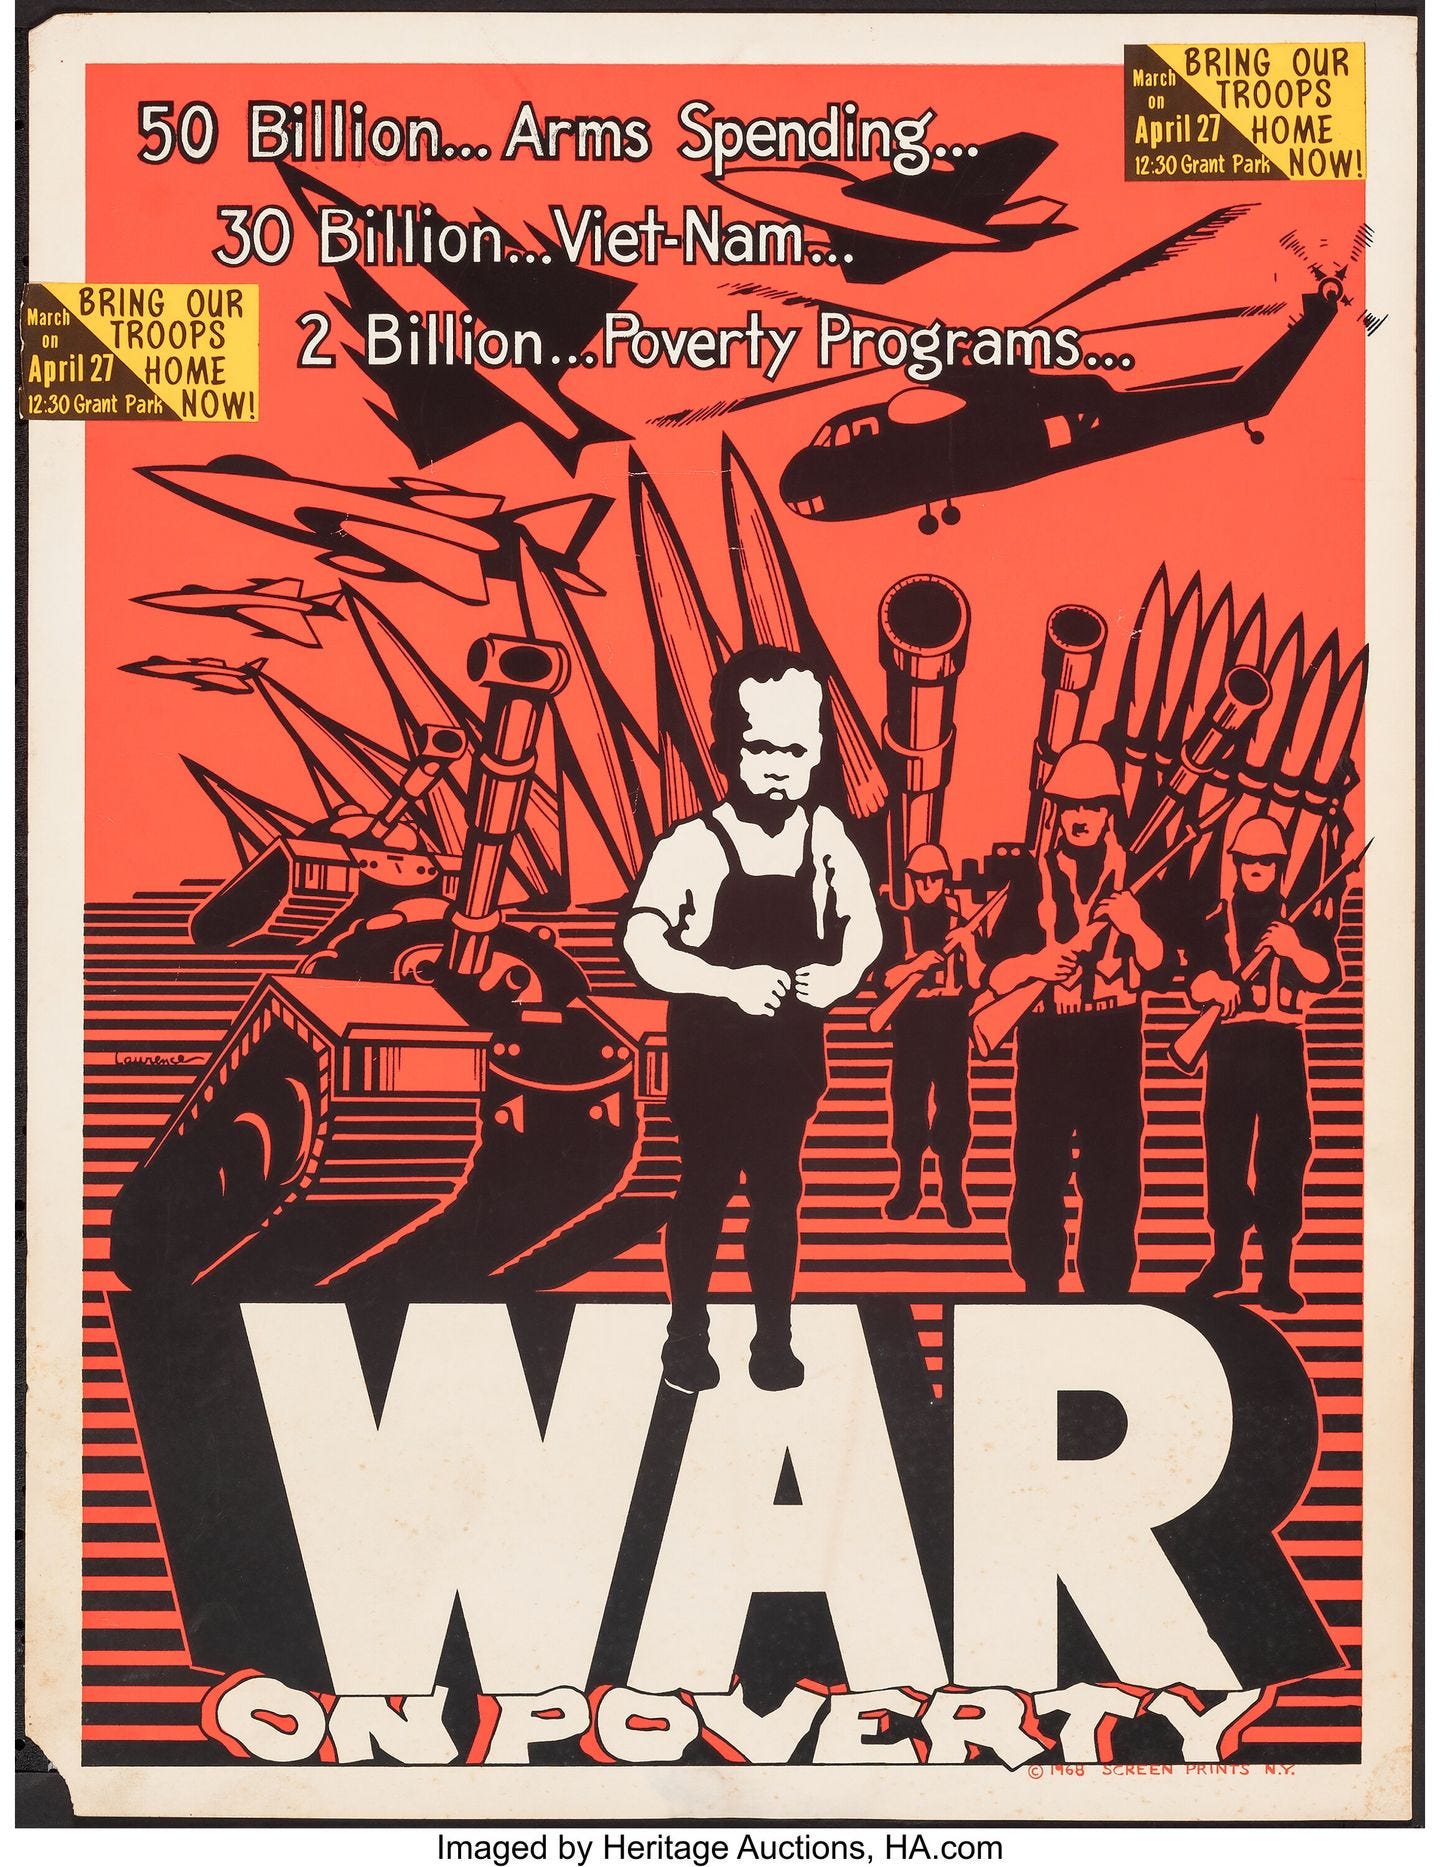
The official U.S. poverty line didn’t fall from the sky; it came from a very specific moment in time. In the early 1960s, as the country declared a “War on Poverty,” the federal government needed a way to count who, exactly, was poor. An economist named Mollie Orshansky from the newly formed Social Security Administration took a practical route: start with a bare-bones food budget and build up from there.
Orshansky published “Counting the Poor: Another Look at the Poverty Profile” in January 1965. This article included a refined and extended version of her poverty thresholds.
At that point, the average American family spent about one-third of its income on food. Orshansky calculated the cost of a “minimum food diet” and multiplied that number by three. That became the poverty threshold. Each year, the government simply adjusted that figure for inflation. The formula was simple, consistent, and surprisingly durable. It still underpins our core measure of poverty today.
What was considered to be a ‘basic diet’?
Staple Grains: Cereals, flour, rice, and pasta.
Legumes and Vegetables: Dry beans (such as navy or pinto beans), peas, potatoes, carrots, and other seasonal or canned vegetables.
Dairy: Nonfat dry milk (powdered milk), processed cheese (often compared to Velveeta), and butter.
Proteins: Canned meats (beef, pork, chicken, salmon), peanut butter, and eggs.
Fruits: Canned juices and seasonal fruits (which were less varied and widely available than today).
Luxury items like soda, chocolate, coffee, or tea were not included, and would provide ‘basic nutritional requirements of 2100 calories’ but was not intended to be a long-term dietary solution.
But the economy changed far faster than the metric did. Food became a smaller slice of household spending, while housing, childcare, healthcare, transportation, and education grew into towering line items. The formula never adjusted to those new realities. Instead, we’ve kept updating an old number as if life’s basic costs stayed neatly in proportion.
“Attempts to define poverty in absolute terms are doomed to failure because they run contrary to man’s nature as a social animal.” - Victor R Fuchs, American Health Economist
The result is a threshold that often defines “not poor” in ways that feel detached from lived experience. In many parts of the country, an income that sits just above the official poverty line is still nowhere near enough to cover rent, daycare, medical bills, and a car that starts in the morning. The line may be administratively convenient, but it’s misaligned with the actual cost of participating in modern American life.
We still rely on this number to determine eligibility for programs, allocate funding, and frame public debates. Which means a measure frozen in the economics of the 1960s continues to shape who is visible, who is invisible, and who gets to be counted as “in need.”
Movement II: What Poverty Really Means
TLDR: Around the world, poverty is increasingly defined as multidimensional deprivation, not just a low paycheck.
If the U.S. treats poverty as a single threshold, many other frameworks treat it as a full landscape. They start from a simple idea: being poor isn’t just about having too little money. It’s about having too little access to the conditions that make a life workable.
The UN’s Multidimensional Poverty Index, for example, looks at overlapping deprivations in health, education, and living standards. It considers nutrition, years of schooling, electricity, drinking water, sanitation, housing materials, and basic assets. A family might have some income, but if they live with chronic illness, unstable housing, and no meaningful access to education, they’re still understood as poor in a meaningful, measurable way.
The World Bank and many OECD (Organization for Economic Co-Operation and Development) countries also use relative measures of poverty. Instead of asking, “What is the absolute minimum?” they ask, “How far is this household from the median standard of living?” A common benchmark is 50% or 60% of median income.
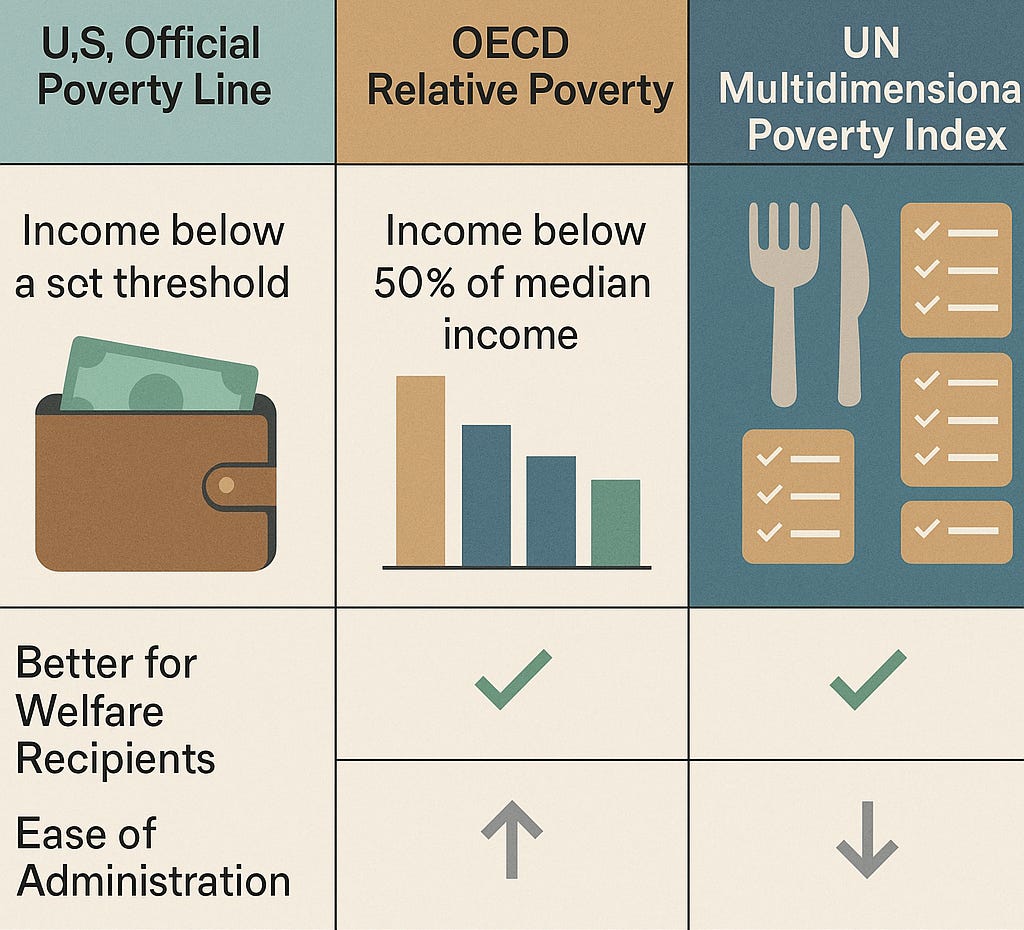
That approach recognizes that poverty is contextual: what counts as deprivation depends on the norms and expectations of the society you’re in.
In these frameworks, poverty shows up as exclusion. It’s the inability to afford internet in a world where homework, job applications, and Teleheath all assume you’re online. It’s the cost of childcare that locks a parent out of the labor market, even if their paycheck technically clears an official threshold. It’s a series of missing rungs on the ladder, not just a number in a spreadsheet.
By contrast, the U.S. poverty line remains narrowly focused on income and anchored to an old food-based formula. It struggles to account for housing insecurity in high-cost cities, student debt burdens, spiraling childcare costs, or the way precarious gig work can leave a household one missed paycheck away from crisis. People may hover above the official line and still live with a constant sense of financial fragility.
For Indie Investors and economic observers, this matters. A country’s poverty statistics are not just social data; they are leading indicators of labor supply, consumer demand, political stability, and long-term growth. If the metric undercounts hardship, the risk is underpriced.
Movement III: The Economic Cost Of Keeping The Floor Too Low
TLDR: Underestimating poverty isn’t just unjust; it’s economically inefficient, depressing productivity, demand, and long-term growth.
Supporting people out of poverty is often framed as moral charity, but from a purely economic lens, it looks a lot more like investing in core infrastructure. When a significant share of the population struggles to meet basic needs, the entire system runs with sand in the gears.
Start with the labor market. When workers can’t secure affordable childcare, reliable transportation, or stable housing, they struggle to participate consistently in the workforce. Employers experience higher turnover, more absenteeism, and a shallower talent pool. That instability doesn’t just hurt individual households; it shows up as lower productivity and higher operating costs across the economy.

Then consider consumer demand. Lower-income households tend to spend a larger share of any additional dollar they receive. When their incomes rise, local businesses feel it first: grocery stores, corner shops, neighborhood restaurants, service providers. Keeping millions of people at or near the margins means keeping a large part of the economy in permanent low gear.
Poverty also drives healthcare costs. Financial stress, food insecurity, unsafe housing, and lack of preventive care all contribute to chronic illness. Those conditions are expensive for public systems and employers alike. When people skip medications to pay rent, or delay treatment because they can’t miss work, the eventual bill — in both dollars and productivity — is much higher.
The deepest cost, though, shows up across generations. Children growing up in unstable, resource-constrained environments are more likely to face reduced educational attainment, lower lifetime earnings, and narrower economic mobility. That’s not just a personal loss; it’s lost innovation, lost entrepreneurship, lost tax revenue, and a smaller future workforce.
In other words, a low poverty line doesn’t just understate hardship. It also helps normalize a level of deprivation that quietly drains growth potential from the entire system. The economy may still expand, but it does so with structural drag — like a bull market running with a weight belt on.
From an investing perspective, this is a miss-priced risk and a missed opportunity. Societies that invest in reducing poverty aren’t just “being kind”; they’re increasing labor force participation, stabilizing consumer markets, and widening the base of people who can start businesses, buy homes, and participate in the upside of growth. A higher floor is not a soft-hearted luxury; it’s a hard-headed strategy for long-term economic resilience.
Finale: How Indie Investors Can Reshape The Poverty Line
How you can play a part in changing this narrative;
✔ Normalize multidimensional poverty in our conversations and analyses.
✔ Support tools that reveal real cost-of-living budgets.
✔ Advocate for “participation thresholds” rather than 1960s-era survival lines.
✔ Frame poverty reduction as workforce and consumer-market strengthening.
✔ Design products that expand access and lower barriers to entry.
✔ Treat the poverty line as a solvable design flaw, not a culture war.
Because at the end of the day, the market is not a monolith.
It is a story we write together.
And a story where more people can participate means more people working, spending, building, inventing — is a market with a richer future!